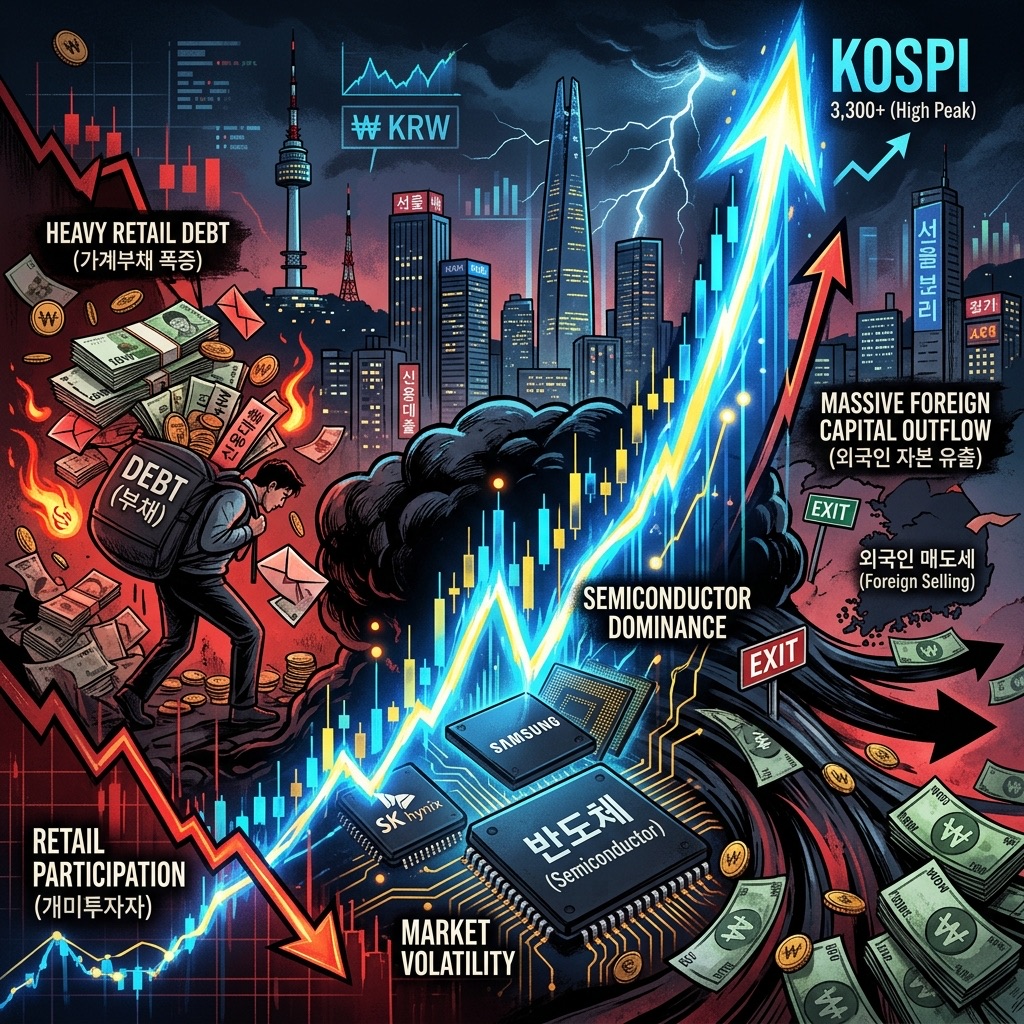
The first half of 2026 was the most extreme stretch in the history of the Kospi and Korea's capital markets. In a word, it was a paradox. The index more than doubled in half a year, yet foreigners sold a record amount, and retail investors absorbed it on borrowed money. And almost the entire rally came from just two chip stocks.
This piece lays out what happened from January through June, why it happened, and which direction the market is heading now. It is not a recommendation to buy any stock, but a map of how the board is set. Verified figures, interpretation, and estimates are kept distinct throughout.
In one line: a record-high index where 90% of stocks fell
It is a genuine bull market underpinned by fundamentals (chip earnings), but four powder kegs sit on top: record leverage (38 trillion in margin debt), record concentration (56% chips), a 17-year-low currency (1,560 won), and a hawkish Fed. Small triggers keep producing nonlinear drops. A high-volatility bull market.
Five numbers compress the half-year.
The Kospi broke 5,000 (Jan 22), 6,000 (Feb 25), 7,000 (May 6), 8,000 (May 15), and 9,000 (Jun 18) all in a single half-year for the first time. Yet over the same span foreigners unloaded their largest net selling ever, dwarfing both the 2008 financial crisis (about -62 trillion) and the 2020 pandemic (about -25 trillion). Circuit breakers, which normally fire once every few years, went off three times in H1 (Mar 4, May 13, Jun 8).
The index month by month: 5,000 to 9,000, and three crashes
| Month | Month-end close (approx) | Monthly change | One-line |
|---|---|---|---|
| Jan | 5,220 | +24% | First break of 5,000 on chips and early foreign buying |
| Feb | 6,244 | +20% | Shook off the Warsh Fed shock, first 6,000, record foreign selling begins |
| Mar | 5,052 | -19% | US-Iran war and oil shock, a -12% single day on Mar 4 |
| Apr | 6,599 | +30.6% | Biggest monthly gain since 1998, a V-shaped rebound |
| May | 8,476 | +28.4% | First break of 8,000, but volatility exploded |
| Jun (to 19th) | 9,052 | +6.8% | First 9,000, but a Jun 8 Black Monday circuit breaker |
One decoupling stands out. In June the Kospi rose +6.8% while the Kosdaq fell to 966.59, down 10.1%. The most direct evidence that money flowed into large-cap chips and nothing else.
Flows: retail and institutions absorbed the 100 trillion foreigners dumped
Cumulative year-to-date flows (Kospi, KRX trading basis) make the picture clear.
Cumulative year-to-date flows (Kospi)
- Foreigners
- -103T to -110T won (record)
- Retail
- +55T to +57T won
- Institutions (financial investment)
- +68T won
- Meaning
- Retail + institutions (123-125T) more than absorbed the selling
One note on reporting bases. Korean flow data mix the FSS settlement basis (all listed stocks) with the KRX trading basis (Kospi only). You cannot add or directly compare the two. The figures above are the Kospi-only trading basis with clear sourcing. "80 trillion since last November" headlines are vaguer than "over 100 trillion year-to-date, Kospi only."
Retail in particular took head-on the Samsung Electronics (+28.5T) and SK hynix (+25.2T) shares foreigners dumped, 53 trillion between the two. The problem is that much of this buying was funded with margin debt. As covered below, that is the single biggest downside risk.
Why it happened: a chain of US-driven external shocks
The volatility was not about domestic fundamentals. It was a US-driven external shock transmitted to Korea, running as one chain.
- Stage 1 - SparkUS-Iran war and an oil spike
War broke out late Feb to early Mar, with threats to close the Strait of Hormuz. WTI spiked to 110-115 dollars (+40-60%). Korea imports about 70% of its crude from the Middle East, so it took Asia's biggest hit.
- Stage 2US inflation reignites, hawkish Fed
May US CPI hit 4.2%, the highest since April 2023. New Fed chair Kevin Warsh scrapped cuts and signaled hikes within the year on the dot plot.
- Stage 3Dollar strength and rate inversion
The US-Korea rate gap inverted by over a percentage point (US 3.50-3.75% vs Korea 2.50%). The dollar index broke 100.
- Stage 4Foreign exit and a weak won
To avoid FX losses and on MSCI rebalancing, foreigners sold Korea and converted to dollars. The won hit 1,560 per dollar on Jun 6, a 17-year low.
- Stage 5 - Vicious cycleHigh FX ties policy's hands
Fear of FX losses fueled more foreign outflows, and the Bank of Korea, hamstrung by the weak won, held at 2.50% for an eighth straight time. Policy was effectively paralyzed.
Mercifully, a 60-day ceasefire MOU was signed on May 24 and the Strait of Hormuz reopened on Jun 16, calming oil (Brent 78.96). On the political side there was a June 3 local election (the widely assumed "June presidential election" did not happen; the last presidential vote was in 2025), but it was noise to the market. The real engines were chip earnings and the value-up policy.
Four structural findings from H1
Finding 1. Foreigners sold, yet their weight rose
Foreigners net-sold over 100 trillion, yet their share of market cap rose from 36.26% to 40.26%. The price surge in their holdings, Samsung and SK hynix, produced a value effect (+9.0 points) that overwhelmed the selling drag (-1.5 points). Their quantity fell but their valuation share rose. That is decisive evidence the selling was profit-taking and MSCI weight normalization, not capital flight. The KRX CEO told CNBC it was "just rebalancing."
Finding 2. Retail took on foreigners head-on, with debt
The fuel for the 53 trillion of Samsung and SK hynix retail absorbed was 38 trillion won of margin debt, 1.48 times the 2021 peak of 25.65 trillion and an all-time record. The flow's protagonist shifted from foreigners to retail leverage, and that is simultaneously the biggest downside risk.
Finding 3. 56% chip concentration is a systemic risk
Samsung and SK hynix make up 56.2% of Kospi market cap, the top four make up 61.8%. A breadth collapse, where 90% of listed stocks fall even on record-high days, became routine. "Strip out chips and the Kospi is 4,200" became a common refrain. The bull market is held hostage to two stocks.
Finding 4. "The Kospi is cheap" is an illusion
| Metric | Value |
|---|---|
| Kospi 12M forward PER (overall) | About 7.6x (looks cheap) |
| Kospi forward PER ex-semiconductors | About 21.71x (expensive) |
| Semiconductor sector PER | About 5.17x (historic low) |
The "Kospi is undervalued" notion is an illusion created by ultra-low-PER chips. Strip them out and it is 22x, expensive. That is the heart of the bubble debate. As KB Securities notes, though, "bubbles do not collapse on their own; they need a trigger like recession or a rate spike."
Direction now: trend up, path a roller coaster
In sum, a genuine bull market underpinned by fundamentals coexists with a high-volatility structure of record leverage and concentration.
The bullish substance is real. AI and HBM supercycle have actually surged chip earnings (Shinhan Securities estimates 244.8% of the past year's Kospi gain is explained by EPS growth), chip PERs are at historic lows, and structural rerating from value-up and commercial-law reform is in place. Brokerage targets keep rising (Goldman 12,000, Hana 10,380, KB 10,500), so the trend itself is alive.
The problem is the four powder kegs on top.
Four powder kegs on top of the bull market
- 38T margin debt
- Record high, forced-selling fuse
- 56% chip concentration
- Breadth collapse, hostage to two stocks
- 1,560 won FX
- 17-year low, foreign FX-loss spiral
- Hawkish Warsh Fed
- Cuts blocked, BOK forced to hold too
The conclusion: the trend is up, but the path is extreme volatility with repeated V and inverted-V moves. More than the index level, what matters is the durability of the two chip stocks, the resilience of retail leverage, and FX and the Fed deciding the inflection points. Three circuit breakers in H1 are the proof.
Upcoming inflection points, in order: the June 24 MSCI developed-market watchlist decision, July's US-Iran ceasefire expiry and National Pension rebalancing restart, and the August-September FOMC and whether the Fed actually hikes.
Scenarios: which way, and how far
The index bands and probabilities below are subjective estimates applying past drawdowns to current verified figures, not deterministic forecasts.
Scenario A: foreigners dump again in size
Triggers: a chip peak-out, renewed US rate and dollar strength, a second MSCI rebalancing, a ceasefire breakdown, domestic leverage liquidation. Retail absorbed +35T in May and +26T in March, but much of that was margin debt, so if the index falls, buying power flips into selling pressure.
| Severity | Pullback | Kospi target band (est.) | Historical reference |
|---|---|---|---|
| Mild correction | -10 to -15% | 7,700-8,160 | Retest of Jun 8 low (7,484) |
| Technical bear market | -20 to -25% | 6,800-7,250 | 2018 trade war, 2022 (-24.9%) |
| Crisis capitulation | -35 to -45% | 5,000-5,900 | 2021-22 (-36%), retest of March low |
| Extreme (2008-style) | -50%+ | Below 4,500 | 2008 (-53%) |
A short-term correction (-10 to -15%) looks likely (55-65%), a technical bear market moderate (30-40%), and crisis capitulation low to moderate (12-20%). But given leverage and concentration, once it starts, speed and depth could exceed the past.
Scenario B: when does the margin-debt overhang hit?
This is the question people ask most, so it gets its own treatment. First, a common misconception: margin debt is not repaid in a lump sum at maturity like a bond. Maturity is typically 90 days, but in practice the risk comes from a collateral-ratio shortfall, not maturity. The trigger is price, that is, the index, not time.
The mechanics: the maintenance ratio is typically 140%. When (holdings value + cash) divided by the loan falls below 140%, a margin call goes out, and forced selling executes at the next day's opening auction. Below 130% it is immediate, same-day to next-day. The scary part is the amplifier. Forced selling is ordered at 15-30% below the prior close (near the daily lower limit), so far more shares than needed dump at fire-sale prices, driving further declines, pushing other accounts below 140% in a chain.
The warning lights are already on. Margin debt is 38 trillion (record on May 29), and on June 9 a single day saw 169.8 billion won of forced selling (six times this year's average, the most since October 2023). VKOSPI (the volatility index) hit a record 91 intraday.
So the answer is not "when" but "at what index level."
| Stage | Kospi range (from peak) | Phenomenon |
|---|---|---|
| Stage 1 | 8,200-8,500 (-7 to -10%) | Sporadic forced selling from high-multiple names. Already happened on Jun 8 |
| Stage 2 (danger) | 7,800-8,000 (-12 to -15%) | Break of the heavy margin-inflow zone, first chain-ignition danger band |
| Stage 3 (panic) | Below 7,000 (-23%+) | Forced liquidation of large May-June margin positions, panic |
Sporadic forced selling (ongoing) is near-certain (90%+); a chain from a break below 8,000 (within 3-6 months) is 35-45%; panic below 7,000 (within 6-12 months, with an external shock) is 15-20%.
Conclusion: the trigger for the margin overhang is not a calendar maturity but a break of the 8,000 level. Much of the 38 trillion was chase-buying in the 7,000-9,000 high range, so the average cost is high and it crumbles fast on small declines. The pattern is volume concentrating in the opening auction one or two business days after a big down candle.
Scenario C: a chip and AI cycle peak-out
The actual drop in price levels is centered on 2027, but the momentum (rate-of-change) peak-out that prices front-run is the watershed in H2 2026. That said, HBM is decoupled from commodity DRAM (HBM4 transition and Nvidia Rubin demand should push 2027 contract prices higher), so HBM-heavy players like SK hynix are defended. The real risk is less the memory price itself than the nonlinear amplification of a small slowdown triggering deleveraging on top of 56% single-sector concentration and 38 trillion in margin debt.
Scenario D: FX stabilizes, foreigners return in earnest (upside)
Foreigners already turned net buyers on June 12 after 25 sessions, but they are selectively concentrated in chips. The master switch is FX. A high won (1,500s) keeps chips ahead; if FX stabilizes below 1,450, buying broadens to financials, holdcos, dividends, and low-PBR. Policy (value-up, commercial law, dividend separate taxation) already favors the latter, so if FX cracks, strength could broaden market-wide.
Scenario E: geopolitical and macro shocks re-escalate
Two dormant states are the variables. The Middle East has a nominal ceasefire but physical normalization of Hormuz is delayed (the late-July ceasefire expiry is the pivot), and the Fed carries surprise-hike risk given 4.2% May CPI and a hawkish-majority dot plot. The most probable path is a Fed-only hawkish turn for a -10 to -15% (7,300-7,800) correction, at 30-40%.
There are also secondary variables that change the depth and speed of any scenario. The biggest secondary risks now are US long-term Treasury yields (the 30-year at 4.92%, nearing 5%) and hidden leverage outside margin debt (overdraft accounts 42.8 trillion, securities lending a record 190.96 trillion). Both are already active and accelerate the downside if they coincide with foreign selling. The buffers, by contrast, are returning retail capital from US stocks (selling US, coming home, +18.3 trillion of Kospi buying in early June) and continued tariff relief.
Investor action guide
- The trend is up, but keep buying in tranches and hold a cash buffer. The trend is alive, but -8% crashes show up every quarter, so all-in buying is forbidden and volatility should be treated as a buying opportunity.
- FX (won per dollar) is the number-one traffic light. A break below 1,450 signals broadening strength; a break above 1,560 signals the foreign vicious cycle. Watch the dollar index, the US 10-year, and Warsh's remarks together.
- Avoid margin debt entirely. It is a record 38 trillion and forced selling has already fired. Beyond not using your own leverage, monitor market margin balances and forced-selling figures as a down-acceleration gauge.
- Recognize both sides of chip concentration. Since the index is chips, piling endlessly into chips means 100% exposure to index risk. Diversify into defense, shipbuilding, power, and value-up names (financials, holdcos, dividends).
Comparing past episodes: which one looks most like now?
Comparing the current setup (record strength + record foreign selling + retail margin absorption + chip concentration + high volatility) against the past, the single closest analog is the 2020-2022 retail-army and margin-debt episode.
| Episode | Peak | Subsequent drawdown | Collapse trigger |
|---|---|---|---|
| 1989 blown accounts | Kospi 1,003 | -54.5% | Margin forced-selling chain |
| 1999-2000 dotcom | Kosdaq 2,834 | -81.5% | US Nasdaq sync, no revenue model |
| 2007-2008 fund boom | Kospi 2,065 | -54.5% | Lehman bankruptcy |
| 2017-2018 chips | Kospi 2,607 | -17 to -23% | Trade war, chip peak-out |
| 2020-2022 retail army | Kospi 3,316 | -36% | Fed giant steps, high FX |
| 2026 now | Kospi 9,064 (ongoing) | Not yet | Latent fuses: hawkish Fed, 1,560 won, 38T margin |
2020-2022 is the closest because the three-beat of retail absorbing foreign selling with direct margin debt, with a hawkish Fed and high FX as the trigger, overlaps exactly. One decisive clue: back then margin balances peaked in September 2021, about 2.5 months after the index peak (June 2021). Leverage lags the index. "Margin debt is still rising, so we are fine" was the most dangerous illusion.
That said, the current setup is not a single analog but a composite of risk factors from multiple collapses. The 2007-08 foreign exodus, the 1989/2020-22 direct-margin self-amplification, and the 2018 chip concentration (double this time) combined at one moment for the first time. The mitigating factor is that the leaders are based on HBM and AI earnings, not revenueless ventures, so a naive 1999-2000 style -80% extrapolation is inappropriate.
National Pension July rebalancing: a selling bomb?
The widely feared National Pension selling bomb was largely defused on May 28, 2026. The myth versus the fact:
| Myth | Verified fact |
|---|---|
| Cutting domestic equity weight to 20.8% to force selling | The opposite. The May 28 committee raised the target from 14.9% to 20.8%. A move to reduce selling |
| 7-8 trillion of monthly selling on normalization | Not an official figure but the upper bound of a single Barclays estimate. Actual is likely smaller and slower |
The point is not "cut the weight and force selling" but "raise the target itself to reflect the bull-market overshoot and ease selling pressure." The avoided bomb was commonly cited as 170 trillion. Residual mandatory selling (tens of trillions, gradual) remains, and July is a test not because of a separate decision but because it is the first month the January moratorium ends in late June.
But the real watch point is not a National Pension dump. Its selling runs on rules (band breaches), not sentiment, so the crash trigger is more likely renewed foreign selling and margin forced selling. The fund's own risk is not selling but the 2022-style trap of holding peak weights it cannot sell (domestic equities returned -22.76% then). By blocking selling it protected the market, but at the cost of carrying 9,000-level positions. Note that the +68 trillion of institutional buying in H1 was financial investment (broker prop, ETFs, programs), not pension funds, so the actor must be distinguished.
SK hynix US ADR listing is separate
Another major event in progress on the same day is SK hynix's US Nasdaq ADR listing. How the local shares rise via arbitrage, whether to buy locally or in the US, and the impact on the Kospi are a different topic and covered separately.
Read: SK hynix ADR, how high can the stock go: a view through the TSMC mirror
The bigger macro regime shift that ran through this half-year (the end of easy money, beta to alpha) is in The End of Easy Money; the FX backdrop in The won breaks 1,500; and the oil backdrop in Israel-Iran war and the oil outlook.
Disclaimer
This piece is market analysis and educational information compiled and cross-checked from public reporting and statistics, not investment advice to buy or sell any security or asset. Figures are as of the writing date (June 22, 2026) and markets change constantly. Some month-end index levels, precise monthly retail/institutional totals, and the exact war start date have conflicting sources and cannot be fully verified, and the scenario probabilities and index bands are subjective estimates based on past drawdowns. All investment decisions and their outcomes are the investor's own responsibility.
References
- Kospi starts 2026 on a fresh high (Korea Herald)
- Cumulative -103.25T, foreign ownership 36.26 to 40.26% (Wikitree)
- Year-to-date -109.57T, above 2008 and 2020 (Financial News)
- Kospi selloff is rebalancing, not a vote against Korea: KRX CEO (CNBC)
- Retail buys Samsung 28.48T, SK hynix 25.19T (MoneyToday)
- Margin debt tops 38T for the first time (Etoday)
- 169.8B forced liquidation after an 8% drop (Financial News)
- Forced-selling timing, 140%/130% process (KB Think)
- Samsung + hynix top 56% of market cap (Financial News)
- Ex-chips PER 22x, bubble warning (NewDaily)
- Won breaks 1,560 overnight, 17-year high (Financial News)
- Fed chief Warsh's first FOMC (NPR)
- Domestic equity target raised 14.9% to 20.8% (Policy Briefing)
- Margin lending balance statistics (KOFIA FreeSIS)