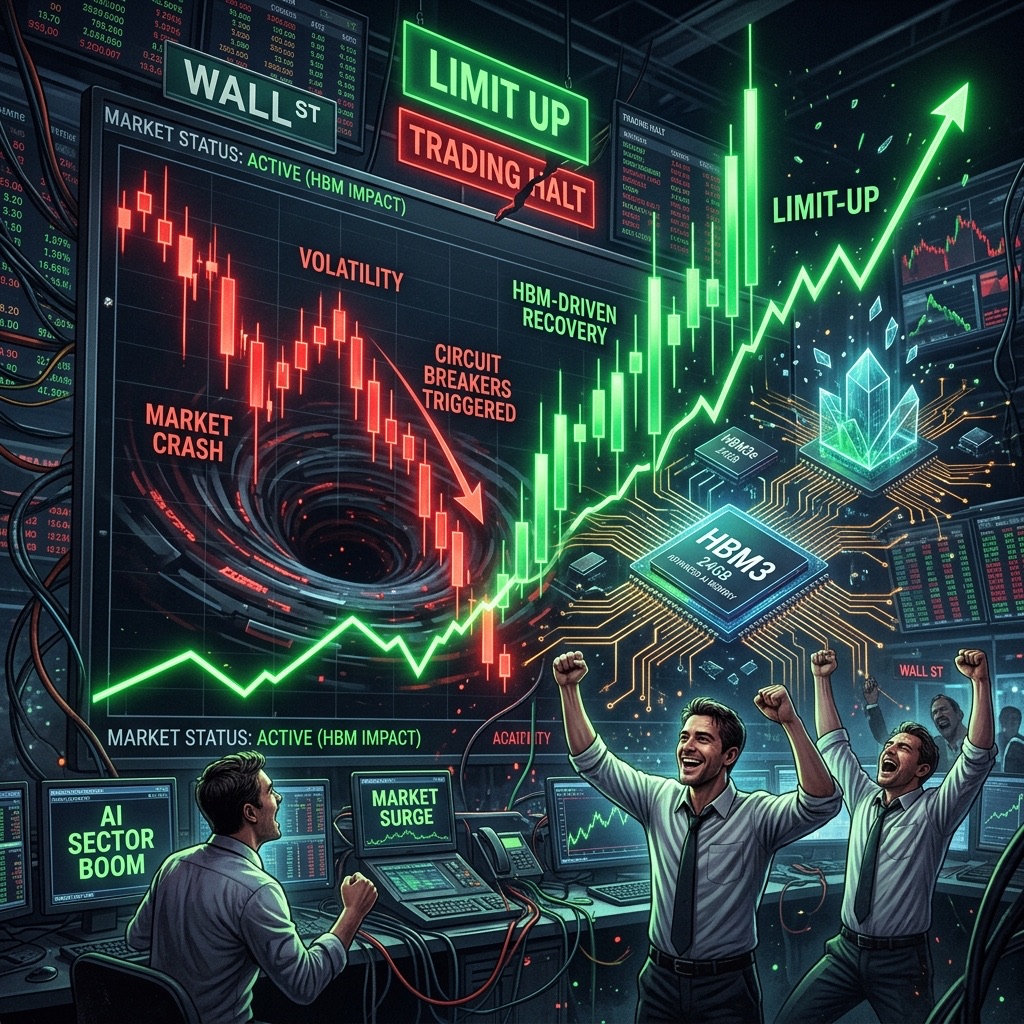
This is a record, not an analysis. From July 21 to August 1, 2026, I held a 10 million won position in SK Hynix through the KOSPI's largest monthly drawdown on record and its largest single-day gain on record, back to back. What follows is what I looked at and what I decided, in the order it happened.
Here is the ending first. Over that stretch I bought nothing at all. Neither the planned second tranche of 5 million won nor the third of 10 million won was ever executed. And on the final trading day Hynix closed limit-up. Some of these calls were good and some were not, and I have left the bad ones in.
Log period summary (July 2026)
- Period
- Tue 7/21 to Sat 8/1
- My position
- SK Hynix common 5M won + 2x leveraged ETF 5M won
- Period low
- Hynix 1,322,000 won (7/30 close)
- Period high
- Hynix 1,718,000 won (7/31 limit-up)
- Additional buys executed
- None (zero)
Why I hung the trigger on events instead of price
Scaling in usually fails the same way. You decide you will buy the dip. And then it does not dip, it just goes up, and you own nothing. Conversely, if the stock really does reach the price you wanted, that usually means something genuinely bad happened.
Scaling in exists to solve one dilemma: you do not know whether it goes up or down. I think there is only one answer.
Buy part of it now so you are covered if it rips, and hold the rest back for a dip or an event. And hang the trigger for that remainder on an event that will certainly arrive rather than a price that may not.
If the stock falls, you buy cheaper at the event. If it rises, you can chase after confirmation because your first tranche is already participating. Either way you are neither at zero shares nor all in.
The three buying rules I had written down on July 21 were these.
| Rule | Content |
|---|---|
| Rule 1 | Put the first tranche in now, but size it by position in the band. Bottom of band means large, top means small |
| Rule 2 | The trigger for the rest is a dip or an event, whichever comes first |
| Rule 3 | Never go to 100% before the main body (big tech capex) is confirmed |
Where this works and where it absolutely does not
This is the opposite of trend following. It is counter-trend accumulation, which means picking the wrong setup turns it into plain averaging down. My conditions required four things to be true at once.
The four conditions for this setup
- 1. Fundamentals
- Strong earnings and structural demand (mandatory)
- 2. Prior phase
- A large rally that priced the name for perfection
- 3. Current phase
- A 20 to 40% drop from the high, oversold
- 4. The core
- A gap where fundamentals held and only price fell
The point is not to buy oversold conditions but to buy the gap between fundamentals and price. Price collapsed, earnings are fine: that is the signal. And there is a trap here that looks identical from the outside.
| Situation | Nature | Response |
|---|---|---|
| Strong earnings, oversold crash | De-rating, fundamentals intact | Buy |
| Earnings and fundamentals rolling over | A real downcycle | Do not buy. This is the falling knife |
The fork is a single question: are the fundamentals still strong? That is why this strategy mandates confirming capex and HBM guidance, and why it stops the moment those bend.
How a strategy that cannot use stops defends itself
Trend following defends itself with a tight stop. A strategy that buys dips cannot do that, because you get stopped out and then watch it bounce, over and over. So I built five layers instead.
| Layer | Pillar | Content |
|---|---|---|
| 1 | Tranches and dry powder | 500/500/1000. No full size before the main body. Not buying is also defense |
| 2 | Position sizing | Small at the top of the band, large at the bottom |
| 3 | Event gate | Re-verify each tranche against earnings, cancel if bad |
| 4 | Thesis stop | Sell when the fundamentals break |
| 5 | Structural and capital stop | Band extreme breach, or a 20 to 25% hard cap versus cost basis |
In short, the design is to judge whether I am wrong by fundamentals rather than price, and to cap in advance how much I can lose while waiting for that judgment.
My position at the start, and the support bands
This was the actual position when the log began, and it constrained every decision that followed.
My real position (as of 7/21)
- SK Hynix common
- 5M won, cost basis 2,055,812 won
- KODEX SK Hynix 2x leveraged
- 5M won, cost basis 24,089 won
- Total
- 10M won
- My risk rule
- 10M won cap per name
- Status
- At cap, no new adds permitted under the rule
There is already a problem here. My rule is a 10 million won cap per name, and Hynix was already at that cap. Which means the second tranche of 5 million and third of 10 million I had planned were not executions of the rule but exceptions to it. I nailed that fact to the top of the document so I could not confuse myself later: if I follow the rule, Hynix is finished, and my only remaining moves are rebalance, reduce, or hold.
The 10 million figure is not arbitrary. It is sized against upside and downside I read as 2 to 1 here. A loss stays inside a share of the account I can absorb, while a move in my favour still pays meaningfully at that size. It is my risk tolerance written down as a number.
The support bands I had pulled from the underlying analysis looked like this. This table serves as the scorecard for the rest of the log.
| Name | Expected support band | Extreme (structural stop) |
|---|---|---|
| SK Hynix | 1.65M to 1.85M won | 1.45M won |
| Samsung Electronics | 220K to 250K won | 200K won |
| Micron | $700 to $850 | $700 |
| SanDisk | $1,030 to $1,300 | $1,030 |
And this was the calendar sitting in front of me. Whichever way the stock went, these dates were going to arrive.
Tuesday, July 21: the bounce came first and I did not buy
The day the log starts.
7/21 confirmed close
- KOSPI
- +3.56%
- SK Hynix
- 1,836,000 won (+4.08%)
- Samsung Electronics
- 259,000 won (+6.15%)
- Customer deposits
- 106.7 trillion won
- Margin loan balance
- 33.07 trillion won
A big bounce one day after a crash. My first tranche of 5 million was down about 10%. The problem was that this bounce pushed Hynix back into the upper half of the 1.65M to 1.85M band.
This is where the itch starts. Was that the bottom? If I do not buy here, do I miss it? But my Rule 1 says small at the top of the band. Not "do not buy" but "only a little if it is high." And chasing the top of the band while already at my cap would have been a straight violation.
What I wrote in the log that day was this: the chance to accumulate at the bottom of the band is gone. The bounce arrived before the event, so the next trigger is not a dip, it is an event. Tranche two got pushed to Alphabet on July 23.
Thursday, July 23: the green light fired and I failed to buy
Alphabet's Q2 landed on the night of July 22. Against my checklist it was close to a perfect score.
Alphabet Q2 actuals
- Revenue
- $119.8B (+24%)
- Google Cloud
- $24.8B (+82%)
- Backlog
- $514B
- Cloud operating margin
- 20.7% to 35.6%
- Capex guidance
- $180-190B raised to $195-205B
- AI infrastructure raise
- $80B
Scored against the checklist:
| Criterion | Result | Verdict |
|---|---|---|
| Capex maintained or raised | Raised sharply, roughly $200B | Pass |
| Cloud around +67% | +82%, accelerating | Pass |
| Any efficiency or discipline language | None, they raised capital to spend more | Pass |
| Data-center regulation or capacity delay comments | None | Pass |
Cloud accelerated from +63% the prior quarter to +82%, and they raised capex rather than trimming it. For memory demand it is hard to ask for a better signal. The headline EPS being up 298% was distorted by equity investment gains, which I had already decided to ignore. The verdict was GO.
And I did not buy.
The morning opened with a spike (Hynix +6.4% intraday) that faded back to about +1.5%, near 1.85M won. At the time I read the fade as "no reaction, so a good environment to accumulate without chasing," and then failed to pull the trigger anyway. I thought I would wait for a bit more downside.
In the afternoon the market began pricing the trickle-down from Alphabet's capex, and Hynix closed at 1,919,000 won, up 4.86%. The intraday high was +6.5%. The 1.85M level I wanted only existed in the morning, and the close was above the top of my band.
The price of fog. The GO printed overnight and I waited for certainty. I did not want to walk into the morning fog. By the time the fog lifted and it was obvious, the stock was 6% higher. If you will not accept the fog, all that is left after it clears is chasing.
The three lessons I wrote that evening: when the GO fires, I needed the discipline to buy into the fog; chasing at 1.95M is forbidden; and do not let break-even psychology push me into it. What I missed is missed.
Friday, July 24: down 8%, and not buying saved me
7/24 confirmed close
- SK Hynix
- 1,759,000 won (-8.34%)
- Samsung Electronics
- 249,500 won (-7.59%)
- Micron
- $921 (-6.99%)
- SanDisk
- $1,437 (-10.79%)
- Hynix ADR
- $154.6 (-8.81%)
The entire prior-day rally was given back, a round trip to the July 20 level. From 1.92M to 1.76M.
The cause was not memory fundamentals. Crude spiked on US-Iran tension around Hormuz, US equities fell hard, and leveraged ETF mechanical selling and valuation anxiety amplified it. The fact that every Korean and US memory name fell 7 to 11% together was itself the evidence. Single-name fundamental problems do not take the whole group down in lockstep.
I ran the red flags. The 1.65M band floor held (close 1.759M), and HBM, DRAM pricing and capex were all intact. The conclusion was a macro dip, not a fundamental break.
The damage to my position hurt. The leveraged ETF fell 16.7% in one day and sat at -48% versus cost. I was holding exactly the kind of product that amplifies the mechanical selling I was complaining about. From that day, "cut the leverage on the next bounce" became a risk action independent of any buy decision.
And one thing was settled. If I had chased at 1.92M on July 23, I would have been down 8% the next day. More usefully, the level I had missed came back cheaper within a single day.
I updated the plan here. Rather than trying to call a bottom into macro uncertainty, I would confirm fundamentals at the main body on July 29 to 31 (HBM guidance plus capex) and buy in August. That structure does not require me to forecast geopolitics.
Weekend, July 25 to 26: the cause eased and a scarier story started
Over the weekend the US and Iran paused strikes, and Iran and Oman opened talks to scale back Hormuz transit restrictions. Crude fell 5%. The cause of the crash had eased over a weekend.
But a much scarier story was spreading at the same time: the round-tripping thesis on Nvidia.
The claim goes like this. Nvidia invests in OpenAI and CoreWeave and others, who then use that money to buy Nvidia chips, which makes it effectively self-generated revenue. Estimates of the circular flow ran past $800 billion, drawing comparisons to Enron and to dot-com era telecom vendor financing. OpenAI is projected to lose about $14 billion in 2026 with monetization targeted for 2029.
This matters to me because demand durability is the heart of my thesis. If the demand is circular, it is a switch that can be flipped off at any time.
My buffer argument at the time was that the large axis of HBM demand is hyperscalers like Microsoft, Google and Amazon buying with real operating cash flow, not just circular startups. That argument gets partially undermined the following week.
Monday, July 27: a relief bounce, and building the CDS gauge
7/27 confirmed close
- KOSPI
- 6,755.75 (+0.97%)
- SK Hynix
- 1,816,000 won (+3.24%)
- Samsung Electronics
- 254,000 won (+1.80%)
- Customer deposits
- 109.2 trillion won
A mild bounce reflecting the weekend oil drop and geopolitical easing. Back inside the band at 1.816M, with the move restrained because the main body was imminent.
Let me record a mistake I made here. I first logged this day as flat, around -0.5%. That was an intraday snapshot. The Naver quote API returns unconfirmed values during the session too. I re-checked after the close and corrected it to +0.97%.
The real work that day was researching the round-tripping debate down to its structure. In the process I realized the debate had changed character. It had moved from equity valuation to credit.
| Credit market signal | Level |
|---|---|
| Nvidia 5-year CDS | 82bp, up 14bp intraday, the largest one-day move since last November |
| Oracle CDS | 198bp, an 18-year high since the financial crisis. Stock down 40% YTD |
| Big tech CDS notional outstanding | $12.5B, an all-time high |
| Moody's | Top ratings intact at the big four, downgrade pressure only on Oracle and CoreWeave |
| Nvidia corporate bonds | Pursuing a $25B issue, its first in five years |
Equities price sentiment, CDS prices default probability. At Oracle, the CDS widened first and the stock then fell 40%. Credit moves before equity. So I added red flag number six: AI infrastructure credit spread widening.
And this is where I got the most practical lesson of the month.
Never use a reported number as your threshold
When I created the red flag, I used the reported Nvidia CDS of 82bp and set the trigger at 100bp. The next day I pulled the raw data myself. ICE Clear Credit publishes a free API with no authentication, covering 1,113 single names.
The actual standing level was 70bp. The 82bp was the print from the day it spiked. Media write about the day something jumps, so reported numbers sit above the standing level. Had I trusted 82, my 100bp trigger would have required a 43% widening from reality: an alarm that would essentially never fire.
I replaced every threshold.
| Name | 7/24 actual | Category |
|---|---|---|
| CoreWeave | 674bp | Leveraged |
| Oracle | 201bp | Leveraged |
| Meta | 92bp | Hyperscaler band top |
| Broadcom | 90bp | Semis |
| Intel | 77bp | Semis |
| SK Hynix | 75bp | The name itself |
| Nvidia | 70bp | Center of the loop |
| Amazon / Alphabet / Microsoft | 69 / 66 / 54bp | Hyperscalers |
Two findings came out of this. First, Nvidia at 70bp is below Meta and Broadcom. The credit market still files Nvidia inside the hyperscaler group, meaning the equity market's round-tripping skepticism has not reached bond prices. Second, SK Hynix's own CDS is directly observable, and being an Asian name it posts a day earlier than US names. That makes it usable as a leading indicator on the name itself.
The revised trigger ladder:
| Stage | Condition | Action |
|---|---|---|
| Caution | Nvidia crosses the hyperscaler band top of 92bp | Slow down tranche 3 |
| Fire | Nvidia breaks 100bp and holds | Count as one red flag |
| Fire | Any of the four hyperscalers breaks 100bp | Count as one red flag |
| Fire | SK Hynix's own CDS breaks 100bp | Direct signal, highest priority |
| Fire | An actual investment-grade downgrade at Oracle or CoreWeave | Count as one red flag |
One design choice matters. Oracle and CoreWeave alone cannot fire this flag. Both are already structurally dependent on borrowing, so they are broken clocks. It only means something if it spreads to Nvidia itself or the four hyperscalers. That design pays off precisely one day later.
And then Hynix walked into the loop
The same research turned up one more thing. Three days earlier, on July 24, SK and Nvidia signed a letter of intent worth $500 billion at the K-AI summit in San Francisco. SKT builds Korea's largest 2-gigawatt AI factory on Nvidia's next-generation GPUs with Nvidia investing in it, and SK Hynix supplies HBM long-term and co-develops with them. It phases into operation from 2027.
Follow the money and it looks like this.
| Flow | Content |
|---|---|
| Nvidia to SKT | Invests in the AI factory |
| SKT to Nvidia | Buys GPUs with that money |
| SKT to SK Hynix | Buys HBM |
| SK Hynix to Nvidia | Supplies HBM |
Look again at the buffer argument I made over the weekend: the loop is an OpenAI and CoreWeave story, while Hynix demand comes from hyperscalers spending real cash. That argument was partly invalidated as of July 24. Part of Hynix's demand is now explicitly inside the circular structure.
Do not overrate it, though. A letter of intent is not a contract. Committing and disbursing are different things, and the proof is Nvidia's own $100 billion commitment to OpenAI of which only about $30 billion was actually deployed. The 2 gigawatts also phase in from 2027. Do not read $500 billion as revenue.
So I split demand into three layers and re-mapped where Hynix sits.
| Layer | Structure | Hynix exposure |
|---|---|---|
| True circularity | Nvidia invests and the money buys its chips | Indirect, via OpenAI and CoreWeave |
| Vendor financing | Nvidia guarantees debt. Revenue is real but the credit risk concentrates on Nvidia | Newly exposed via the 7/24 LOI |
| Real demand | Microsoft, Google, Amazon and Meta buy with operating cash flow | Still the bulk of it |
The third layer being the bulk of it has not changed. Which is why the main body, whether hyperscalers keep spending real cash on capex, is still what decides this.
Tuesday, July 28: Black Tuesday, and the CDS did not move one basis point
7/28 confirmed close
- KOSPI
- 6,023.66 (-10.84%), below 6000
- KOSDAQ
- 705.85 (-7.72%)
- SK Hynix
- 1,550,000 won (-14.65%), close = low
- Samsung Electronics
- 220,000 won (-13.39%)
- USD/KRW
- 1,460.70 (-0.36%), won stronger
At 10:21 a sell-side sidecar hit both boards, followed by a circuit breaker. It was the eighth of the year and the sixth crash of the month.
Then I saw this number. KOSPI July return: -28.9%. The largest monthly drawdown on record before this was -23.1% in October 2008, during the financial crisis. This was worse. An all-time record on a monthly basis.
Worse still, the close was the low. There was no late-session bid at all, and if anything selling concentrated into the bell.
My account looked like this.
| Invested | Cost basis | 7/28 close | P&L | Value | |
|---|---|---|---|---|---|
| Common | 5M | 2,055,812 | 1,550,000 | -24.6% | 3.77M |
| KODEX 2x leveraged | 5M | 24,089 | 9,930 | -58.8% | 2.06M |
| Total | 10M | -41.7% | 5.83M |
The leveraged product was down 77.6% from its June high. Over the same window the common was down 46.9% from its high. Volatility drag ate an extra 30 percentage points. Running the recovery math, the common needed +32.6% to get back to cost and the leveraged product needed +142.6%. That is a level from which cost recovery is effectively out of reach.
The one line I held onto that day
The first thing I checked in the panic was not the tape but the CDS gauge I had built the day before.
| Name | 7/24 | 7/28 | Change |
|---|---|---|---|
| CoreWeave | 674bp | 686bp | +12 |
| Oracle | 201bp | 197bp | -4 (improved) |
| Meta | 92bp | 94bp | +2 |
| Broadcom | 90bp | 93bp | +3 |
| Intel | 77bp | 79bp | +2 |
| Nvidia | 70bp | 78bp | +8 |
| SK Hynix | 75bp | 75bp | 0 |
| Amazon / Alphabet / Microsoft | 69 / 66 / 54 | 69 / 67 / 55 | ~0 |
The equity lost 14.65% in a session and the company's default risk did not move one basis point. Nvidia moved 8bp and even that stayed inside the hyperscaler band top of 94bp. Oracle actually improved by 4bp.
The credit market did not concede any impairment to Hynix's ability to pay. This was an equity flow event, not a credit event.
The reason I built that gauge was realized exactly one day after building it. Without those numbers I would have done something at that close. Sold or bought, but something.
One more test: is this Korea exit or semiconductor risk-off?
Foreigners sold 4 trillion won on the main board in a single day, and the "Sell Korea" headlines followed. So I checked FX.
If money is genuinely leaving the country, the won proceeds have to be converted into dollars, so the exchange rate should spike. Instead it went from 1,466.00 to 1,460.70, meaning the won strengthened. Supporting that, semiconductor-heavy KOSPI (-10.84%) fell more than KOSDAQ (-7.72%). That is a different animal from a phase where the currency breaks too.
Why the close printed at the low
Digging into flows, I found something odd: the correlation between SK Hynix daily returns and net buying by investor type.
| Investor | 7/13-7/27 | 7/13-7/28 | Character |
|---|---|---|---|
| Institutions | +0.81 | +0.53 | Pro-cyclical. Broke pattern on 7/28 |
| Foreigners | +0.61 | +0.71 | Selling harder |
| Retail | -0.85 | -0.88 | Buys the drop, contrarian |
Rebalancing is counter-cyclical by definition. Institutions at +0.81 is the opposite. In this dataset the group that behaves like a rebalancer is retail, at -0.88. So why were institutions buying strength and selling weakness?
The answer was single-stock leveraged ETFs. Korea listed 2x and inverse products on Samsung Electronics and SK Hynix on May 27, 2026, and money poured in within a month.
Single-stock leveraged ETF flows (6/16-7/15)
- Net inflow, 16 products
- 7.34 trillion won
- KODEX Hynix 2x
- 3.45 trillion won
- Retail net buying, 7 Hynix leveraged products
- 4.24 trillion won
- Current losses
- Down more than 40%
A leveraged ETF must buy on the way up and sell on the way down every single day to hold its target exposure, and that trading is tallied as institutional flow in Korean statistics. A 2x product has to adjust exposure by twice the underlying's move, so on a day Hynix falls 14%, it has to sell close to 28% of net assets.
That same day the Financial Services Commission effectively confirmed the diagnosis.
| Measure | Content |
|---|---|
| Effective 7/31 | Minimum cash deposit for single-stock leveraged purchases raised to 30 million won |
| Under review | A per-investor cap of 20% of total financial investment holdings |
| Guidance to the industry | Spread out rebalancing that concentrates just before the close |
That last line is the tell. The regulator publicly identified the concentration of rebalancing into the closing auction, and Hynix printing its close exactly at its low (1,550,000) was the fingerprint. A large share of that pro-cyclical institutional flow was not judgment at all. It was mechanical size at the bell.
One caveat: this rule cuts both ways. It dampens downside amplification, but it also blocks inflows on the way back up.
A finding: five trillion of margin debt was already gone
While sizing forced-selling risk I tracked margin loan balances and found a different picture than I expected.
| Date | Customer deposits | Margin loan balance |
|---|---|---|
| 6/29 | 132.5T (peak) | 37.21T |
| 7/03 | 118.3T | 37.18T (peak) |
| 7/10 | 105.6T | 35.03T |
| 7/16 | 108.1T | 32.86T |
| 7/22 | 103.9T (trough) | 32.57T |
| 7/24 | 105.6T | 32.20T |
Margin balances had already fallen from 37.18 trillion on July 3 to 32.20 trillion on July 24, about 5 trillion won or 13.4%. The accurate sentence was not "38 trillion of margin debt is still sitting there" but "5 trillion has already been flushed and 32 remains." A large share of the forced selling had been front-loaded, which makes the coming margin-call risk smaller than my first estimate.
The urge to average down, and the self-check
This is where the strongest temptation arrived: break the rule and take the common position from 5 million to 20 million. The math came out like this.
| Step | Common invested | Cost basis | Versus 1.55M |
|---|---|---|---|
| Current | 5M | 2,055,812 | -24.6% |
| +5M | 10M | 1,767,436 | -12.3% |
| +10M | 20M | 1,651,570 | -6.2% |
Including the leveraged sleeve, the break-even price for the whole position drops from 2.37M won to 1.89M won, a 480,000 won improvement. The June 22 high was 2.919M, so 1.89M is a price that can plausibly come back while 2.37M is much further away. That is not a trivial benefit.
Then I priced the cost. Here is the case where it falls another 40% and Hynix reaches 930,000 won.
| Value | Loss | |
|---|---|---|
| Hold current (10M invested) | ~2.67M | -7.33M |
| Raise common to 20M (25M invested) | ~11.67M | -13.33M |
Moving break-even down 480,000 won costs 6 million won of additional worst-case loss. Averaging down does not buy probability, it buys bet size. Your odds are unchanged. Both the win and the loss get bigger.
And this is not applying the rule, it is rewriting it. I defined 10 million won as the amount I can absorb. Twenty-five million rewrites that definition by 2.5x. There is no law against doing it, but it has to be recognized as redefining my risk tolerance, not using a remaining opportunity. Beyond that, tranches two and three were designed as staged entries early in an up-cycle. What I was contemplating was averaging down at -41.7%. The mechanics are identical, the nature is not.
I ran the self-check I had written in advance.
| Question | Answer |
|---|---|
| Emotion: does imagining the extreme drawdown keep me up at night? | Signal that size is already too big |
| Arithmetic: can I absorb a 13.33 million won loss? | No |
| Discipline: am I raising size because conviction grew, or because losses grew? | Closer to losses |
The third question settled it. I was mistaking break-even psychology for conviction. I kept the 10 million won cap.
The scorecard and the call
Red flag scoring came out as follows.
| No. | Signal | Status |
|---|---|---|
| 4 | Band floor (1.65M) breach | Fired. Confirmed at 1.55M close |
| 6 | Credit spread widening | Not fired. Nvidia 78bp, Hynix unchanged at 75bp |
| 3 | Hyperscaler capex cuts | Pending, 7/29-30 |
| 1, 2 | HBM ASP and DRAM spot | Unverified |
| 5 | Data-center order cancellations | Not fired |
One flag means "slow down adds and reduce weight" under my rules, not the full stop that two or more would trigger. And the combination of flag 4 firing while flag 6 stays dark defines this phase: price broke, credit did not.
The day's conclusion was one line. No panic in either direction. No panic selling, no panic averaging down. The main body was the next morning, and there was no reason I could not wait one day.
Wednesday, July 29: record earnings, and the stock crashed
7/29 confirmed close
- KOSPI
- 5,663.24 (-5.98%)
- SK Hynix
- 1,401,000 won (-9.61%)
- Samsung Electronics
- 208,500 won (-5.23%)
- Circuit breaker
- 12:32, two days running, a first in market history
- Two-day cumulative (vs 7/27)
- Hynix -22.9%, KOSPI -16.2%
SK Hynix reported Q2 before the open.
| Item | Figure |
|---|---|
| Revenue | 79.3 trillion won (+257% YoY) |
| Operating profit | 60.5 trillion won (+557% YoY), a quarterly record |
| However | Missed consensus |
| And | Part of high-value HBM shipments deferred to H2 |
| Guidance | Positive. H2 bit growth above H1, HBM4 ramp, rising ASP |
A record quarter, and the stock fell 9.61%. Nor was this July's first. Micron on 6/24, Samsung on 7/7, the Hynix ADR on 7/10 and TSMC on 7/16 had all been through the same pattern: post a good number, fall that day. KOSPI dropped as much as 10.8% intraday (5,371) before closing at -5.98%, and Hynix recovered from an intraday low of 1.338M to close at 1.401M, up 4.7% off the low. Bids showed up at the lows, which was better than a panic close, but it was still a crash.
Three causes overlapped. China's Moonshot released Kimi K3, a cheap-AI shock that spread the idea that inexpensive AI threatens demand for expensive chips. Reports of Nvidia discussing a $250 billion commitment to OpenAI plus Michael Burry's bubble warnings reignited round-tripping fears. And the symbolism of CXMT's listing the day before was still hanging around.
Then I pulled the two catalysts apart and they favored my thesis
This was the core research of the day.
The China hardware threat does not hold in HBM. SK Hynix has more than 50% HBM share and had pre-secured two thirds of Nvidia's HBM4 volume. Gross margin runs 60.4% at Hynix versus 38% at CXMT, and decisively, CXMT's IPO prospectus contains no HBM investment plan at all. CXMT going from 3% to 8% of commodity DRAM in a year is real, but that is exactly my original thesis: commodity is a matter of time, HBM is the moat.
The market read Kimi K3 backwards. A 2.8 trillion parameter model needs roughly 1.4TB of memory to run, and 4-bit quantization shifts load from compute to memory. Wall Street's read was the Jevons paradox: cheaper AI drives an explosion in usage, which increases memory demand. The same pattern as DeepSeek in January 2025.
That left exactly one risk that research could not erase: round-tripping. Which means whether hyperscalers keep spending real cash on capex becomes the only genuine test.
The stop rule fired and I did not execute it
This was the hardest spot in the whole log. The Hynix close of 1.401M is below my second-layer structural stop of 1.45M. Mechanically, the structural stop had fired.
But my operating principle says layer one (thesis) has priority and layers two and three are backstops for when the thesis is ambiguous. And that day the thesis was not ambiguous. It had strengthened, because the research had refuted both catalysts.
The rules conflicted and I chose the thesis. I knew at the time it was arguably a rule violation. What I did settle on was this: hold the common while the thesis lives, and treat the leveraged sleeve as a disposal candidate regardless of the thesis. Throwing both away together is panic, not rules. Holding both without thinking is not a decision either.
Why only retail sold on a record-earnings day
The flows that day were striking. Market-wide, retail sold 1.98 trillion won, institutions bought 3.15 trillion, and foreigners sold 1.22 trillion. On the day of a record quarter, retail was the largest seller.
The reason was force, not judgment. Retail investors levered through margin loans and leveraged ETFs saw collateral values collapse after a 22% two-day drop, and got liquidated. Margin calls do not care about earnings. If collateral is short, it sells. Forced liquidations were up 596% in half a year, totaling 344.2 billion won in July alone.
And forced selling only applies to retail. Foreigners and institutions are not subject to Korean margin liquidation, so the selling concentrated on one group, and institutions who had read the earnings and guidance took the other side.
There is an implication for my own position. I hold 5 million won of a leveraged product, but because I used no margin, I cannot be force-sold and I get to choose. In this phase that was close to my only edge.
Thursday, July 30: demand confirmed, then rates buried it
I made the same mistake again this day. At 10:30 a.m. I saw KOSPI +2.83% and Hynix +0.86% and wrote down "relief rally." The close was the exact opposite.
7/30 confirmed close
- KOSPI
- 5,593.56 (-1.23%)
- SK Hynix
- 1,322,000 won (-5.64%), another new low
- Samsung Electronics
- 207,000 won (-0.72%)
- 10:30 a.m. provisional
- KOSPI +2.83%, Hynix +0.86%
- Versus 7/27
- Hynix -27%
The new problem was not AI, it was rates
The FOMC held rates. But Chair Warsh flagged tightening coming from long-end yields, and the 30-year Treasury yield broke 5.2% intraday, the first time since 2007. Risk assets sold off broadly and US equities fell (Dow -2.19%, Nasdaq -1.74%).
Nothing about the AI or memory thesis got worse. A separate macro axis appeared. This is a category of problem my thesis cannot defend against, so I wrote it straight into the scenarios.
Main body part one: Microsoft and Meta
Reported after the US close on July 29. Demand was confirmed and the stock reactions went in opposite directions.
| Microsoft | Meta | |
|---|---|---|
| Revenue | $90B (+18%) | $60.8B (+28%) |
| Key metric | Azure +43%, next quarter guided to ~45% | EPS miss ($2.4B legal charge) |
| Capex | FY27 restrained at ~$175B | Raised sharply to $130-145B |
| Commentary | "Demand exceeds supply, capacity constrained" | "Flooded with premium compute offers, no demand shortfall" |
| After hours | +7-8% | -10% |
Microsoft said it would add 88 data centers within the year, and Meta nearly doubled capex versus the prior year. Both stated explicitly that demand is not short.
The question changed. The market has stopped asking whether demand is real and started asking whether the free cash flow can keep funding this capex. Meta falling 10% for raising capex is the proof.
But from the memory side the sign flips. If Meta raises capex, memory demand rises, regardless of what Meta's stock does. The customer can get punished while the supplier gets the volume. The risk is if the market keeps punishing capex, because that eventually creates capex discipline pressure, and that is the real threat.
This confirmation weakened the downcycle scenario. The two companies actually spending cash directly contradicted the "artificial demand" claim at the heart of round-tripping fear.
Flows had already turned while the index fell
The real signal that day was here. Market-wide, foreigners broke a four-session selling streak and bought 1.33 trillion won. Retail kept selling (1.42 trillion) and institutions were flat.
The index fell while the buyer had already returned. Single-name data confirmed the previous day (7/29) had already turned: Hynix foreign selling halved from 1.826 million shares on 7/28 to 922,000, with institutions buying 791,000. Samsung was cleaner still, with foreign selling decelerating, institutions buying 5.972 million shares, and retail capitulating with 2.435 million shares sold.
Which produced an interesting comparison. That morning Samsung was up as much as 3.84% while Hynix managed only 0.86%.
Hynix lagged not because retail was gone but because retail was still there. Samsung's retail capitulated and cleared the overhead supply. Hynix's retail was still holding, so the supply was waiting overhead. The cap on a rally is not the absence of retail but the wall of trapped retail.
How to confirm a bottom: the weekly-candle method
One rule I formalized that day. Daily bars and intraday prints are too noisy right now, given +2.83% flipped to -1.23% in a single session. Weekly bars measure a full week of force and filter that noise out.
A downtrend is a chain of lower weekly highs. The chain breaks the first time a week takes out the prior week's high. There is a trap, though: the high of a week that makes a new low is far too far above. This week (7/27-31) had a high near 1.81M, and getting there from 1.32M would require a 37% week.
So the real trigger is this: first a bottoming weekly candle forms (a narrow range with a long lower wick that stops making new lows), and then the following week takes out that candle's high. It is late, but it does not get fooled by dead-cat bounces. You are not calling the bottom, you are confirming it and following.
I want three things to line up: the weekly breakout, foreign net buying sustained three days or more, and a stable 30-year yield.
I also priced the other side of the cycle
Talking only about demand hides something, so I laid out the supply clock that day.
| Timing | Content |
|---|---|
| Q4 2026 | DRAM contract price growth rate (YoY) peaks. Not a fall in absolute prices, a bend in the rate of increase |
| Q4 2026 to Q3 2027 | Estimated window for the absolute price peak |
| H2 2027 | Samsung and SK new fabs ramp, Micron Idaho fab. Volume growth begins in earnest |
| 2028-2029 | Genuine oversupply risk |
And here is the crux. Equities typically price in an earnings peak six to twelve months ahead. That puts the equity peak and the start of de-rating somewhere between H2 2026 and H1 2027. Which is now.
So this crash may not be purely demand fear (round-tripping, Kimi, rates). It may be the early innings of 2027 supply and margin peak being priced in. If that is true, the upside on "demand is real so buy" is more limited than it looks. I am willing to expect a bounce without dropping this caveat.
Friday, July 31: limit-up
7/31 confirmed close
- KOSPI
- 6,595.45 (+17.91%), largest gain on record
- SK Hynix
- 1,718,000 won (+29.95%), limit-up
- Samsung Electronics
- 262,500 won (+26.81%)
- Session shape
- Opened near the low, closed near the high
- Foreign flows
- KRX +7.2 trillion, +8 trillion including NXT
Hynix, the weakest name the day before at a new low of 1.322M, went limit-up in a single session. A buy-side sidecar triggered for the first time in 11 sessions.
Main body part two completed the demand case
| Company | Content |
|---|---|
| Amazon | Revenue $200.6B (+20%), AWS +37%, best in 18 quarters, capex raised from $200B to $220B, +8-9% after hours |
| Samsung | Chip revenue 127.5T won, operating profit 89T won, an all-time record, HBM crossed 50% of DRAM revenue for the first time, 12-layer HBM4E samples |
| Apple | Revenue $109.4B (+16%), iPhone +22%. Fell after hours on soft guidance and memory supply constraint concerns |
Apple is the interesting one. "Memory supply constraints," a negative for Apple's stock, is confirmation that memory supply is tight from the memory side. The same sentence is bad news for the buyer and good news for the seller.
Three hyperscalers raising capex, both Korean memory makers posting record profits, and Apple proving on-device demand. The demand fear was fully refuted and the downcycle scenario died.
Despite the prior day's rate shock, the July 30 US session flipped on Amazon and Apple results, with the Nasdaq up 2.7% in a V-shaped move. The picture is that the Fed can apply downward pressure while big tech keeps hoovering up HBM with its own cash generation.
There was one more hidden engine
The timing of this crash and rebound was too clean, so I went looking. There was a hedge fund called Situational Awareness, founded by former OpenAI researcher Leopold Aschenbrenner, with over $20 billion in assets and a 439% first-half return. It ran a barbell at 4x leverage on equity: long AI hardware infrastructure (Micron, SanDisk, Nebius) and short large-cap semis via puts (Nvidia, Oracle, Broadcom).
The mechanism is identical to the retail margin calls I logged on July 29, only larger.
| Date | Deleveraging event | Hynix in Seoul |
|---|---|---|
| 7/27-28 | Collateral (Micron, SanDisk) collapses, margin call pressure builds | 7/28 Black Tuesday, circuit breaker |
| 7/29 | Forced liquidation cascade intensifies | Second straight circuit breaker, -9.61% |
| 7/30 | Citadel acquires the entire Situational Awareness portfolio, defusing the trigger | -5.64%, not yet reflected |
| 7/31 | Deleveraging overhang confirmed cleared | +17.9%, limit-up, foreigners +8 trillion |
The hardware longs collapsed, collateral broke, Goldman, JPMorgan and BofA issued margin calls, forced liquidation dumped Micron and SanDisk, semis fell in a chain, and it carried into the Korean session the next morning. Situational Awareness also held Hynix ADRs.
Then on July 30 Ken Griffin's Citadel bought the fund's entire disclosed portfolio, defusing the forced-selling trigger. The next day was July 31.
Three layers of forced selling overlapped to make the crash, and all three unwinding made the rally: retail margin calls, hedge fund deleveraging, and MSCI passive rebalancing. My thesis that forced selling caused the crash got verified all the way up to the institutional level.
The flow handover had been signaling this for days
In hindsight the evidence had been accumulating.
| Metric | Peak | Crash trough | 7/29 | Meaning |
|---|---|---|---|---|
| Margin balance (froth) | 38.0T (May) | 32.20T (7/24) | 32.52T | 5-6T absorbed via deleveraging |
| Customer deposits (dry powder) | 112.5T (7/20) | 103.9T (7/22) | 109.6T | Powder flowed back right after the crash |
Froth flushed out, powder flowed back in: a textbook handover. With fundamentals intact (Hynix CDS unchanged at 75bp), the conditions for a technical rebound were in place. And on July 31 it happened.
So why did only Korean memory snap back this hard?
One more thing I checked that day. US semis got the same fundamental all-clear, so why did only Korea explode like this? The fundamental worry cleared for all three groups. What differed was valuation.
The cleanest comparison is Micron against Hynix, since both are memory businesses.
| Metric | Micron | SK Hynix |
|---|---|---|
| P/E | ~19-20x | 3.3x |
| HBM share | 21% | 58% |
The company with the better business trades at one sixth the multiple. That gap cannot be explained by business quality. It is a pure Korea discount.
Widening to price-to-sales makes the spectrum clearer: Korean memory at roughly 1.5-2.5x, Micron at 3-5x, Broadcom and TSMC at 10-20x, and Nvidia above 15-25x.
The obvious rebuttal, that earnings will close the gap, did not hold either. Micron's 19-20x P/E already reflects revenue growth of 346%. Both the US and Korean names posted explosive earnings and the relative gap stayed put. The Korea discount does not close on earnings.
They are different in kind. The US carries a growth premium that prices future growth in advance, while Korea carries a structural discount where growth does not lift the multiple. That is why the post-crash snapback was largest in Korea: cheapest, and the best HBM position. For US semis, even with the fundamental fear resolved, valuation and rates cap the upside, Nvidia most of all.
But do not stop there. Cheap does not mean it must go up. The Korea discount has failed to close for years and may well be a value trap. Undervaluation is a downside cushion, not an upside guarantee. When the 2027 supply clock arrives, cheap Korean names de-rate too. And valuation and volatility are separate axes. Korea scores on both.
What I actually decided that day
Two decisions while watching the limit-up.
First, no chasing. A low of 1.322M and a close of 1.718M this week makes a powerful reversal weekly candle with a long lower wick. But my own confirmation rule requires next week to take out this week's high of roughly 1.816M. Today is a very strong signal, not a confirmation. And a 30% limit-up carries a large component of emotion and short covering, so a give-back is entirely live.
Chasing a limit-up while already at my 10 million won cap is euphoria, not discipline. What I did not buy is money not earned, not money lost.
Second, the leveraged sleeve goes. This is scenario independent, because waiting is itself a cost in that product.
| Coming regime | Common shares | 2x leveraged |
|---|---|---|
| Up | Full upside | Amplified upside (favorable) |
| Range-bound | Break-even, no time cost | Bleeds via decay |
| Crash | Full downside | Twice the damage |
It bleeds in a range and takes double in a crash. It loses either way. So I decided to use the spike into the close to clear it or switch it into common stock, and to deploy the remaining 5 million won on a pullback next week once the weekend noise clears and support is confirmed.
Buying the dip only counts as discipline if it is conditional. The low at 1.32M has to hold (a higher low), a break back below 1.32M stops everything, foreign net buying has to persist while the 30-year yield stabilizes, and the leveraged sleeve has to be cleared first. All four, or no buy.
And then I did not sell the leverage that day. Why not is something I worked out the next morning.
Saturday, August 1: the US close, and a look back at the week
The week is not really over until the July 31 US session closes. On Saturday morning I pulled the confirmed numbers and wrote the retrospective.
Compressed to five lines, the week went like this.
| Day | Hynix | Event | What that day proved |
|---|---|---|---|
| 7/27 | 1.816M | Relief bounce | The lull before it, waiting on the main body |
| 7/28 | 1.550M | Black Tuesday, circuit breaker | A record quarter does not guarantee the stock |
| 7/29 | 1.401M | Second straight circuit breaker, a first | What retail threw was force, not judgment |
| 7/30 | 1.322M | New low plus a rate shock | The price of fog. The bottom prints when it is least certain |
| 7/31 | 1.718M limit-up | Main body confirmed, foreigners +8T won | It was never about predicting, only about absorbing |
Minus 27% to plus 30% inside one week. The crash was made by three layers of forced selling (retail margin calls, hedge fund deleveraging, MSCI passive rebalancing), and the rally was made by all three unwinding at once (capex confirmed, Citadel taking over the portfolio, foreigners returning). Neither move came from anything Hynix itself did.
7/31 US close, confirmed
- Nasdaq
- 25,373.85 (+1.0%)
- S&P 500
- 7,489.72 (+0.7%)
- Nvidia
- +3.46%
- Micron
- -5%, after +18% the day before
- 30-year yield
- 5.28%, higher still
All three indices closed the week and the month higher. The tape ignored the bond move and bet on Amazon instead. Semis, though, closed their worst month since 2002. Recovering over the last two sessions did not undo the monthly damage.
Micron down 5% is the one to note. That came the day after an 18% gain. It is a preview of what a give-back after a spike looks like, and it can apply directly to Hynix next week.
Why Apple fell is actually a point for memory
Apple beat and still closed down 9%. The cause was next-quarter guidance, and what pressed that guidance is this:
"AI-driven advanced silicon and memory costs, plus supply constraints."
One of the largest memory buyers in the world said on its earnings call that memory is expensive and short, and it is compressing our margin. That is not a supplier talking its book, it is confirmation from the demand side. Apple's pain is Hynix and Samsung's pricing power.
A new demand vector showed up the same week
Google DeepMind released Gemini Robotics 2 (whole-body control, multi-robot, on-device), and Nvidia put out Isaac, Cosmos and GR00T physical-AI models in the same week. That is the direct reason Nvidia rose 3.46%.
It matters because a robot's brain runs on on-device memory. A memory demand axis is forming outside the data centre. It partly offsets the 2027 supply worry I mapped earlier, on the demand-durability side.
Software and semis are a seesaw
This rotation ran all month and I only caught it late.
| Day | Semis | Software |
|---|---|---|
| 7/27 | Crash | Salesforce +7%, ServiceNow +8%, Workday +10% |
| 7/31 | Explosion (Hynix limit-up) | Give-back |
Roughly $3.2 trillion rotated between the Magnificent 7 and chips during July. The logic: buying semis is a bet that more compute is needed, buying software is a bet on apps and cheap AI. Zero sum. Software also carries its own fear, that AI agents eat seat-based pricing.
Memory sits on the semis side of that seesaw. It wins when "more compute" wins. Which gives me a new watch signal: if software starts running again, money is leaving semis.
Confirmed: who actually made the limit-up
Saturday brought the single-name flow data.
| 7/31 | Foreign | Institutions | Retail |
|---|---|---|---|
| SK Hynix | +2.206M shares | +277K | -2.464M shares |
| Samsung | +8.359M shares | +3.619M | -11.681M shares |
Foreigners and institutions made the limit-up, and retail sold heavily into it. There is an important side effect: the Hynix retail overhang that was still sitting there on July 29 got absorbed in that session. The ceiling is lighter by exactly that much.
The rate move was AI, not inflation
The 30-year was what bothered me most all week, so on Saturday I dug into the cause properly.
The FOMC held at 3.50-3.75% for the fifth straight meeting, but it was a hawkish 9-3. Three members dissented for a hike, and the dot plot has no cuts in 2026.
The 30-year is the problem. It has been above 5% for 30 consecutive sessions, the longest run since 2007. And the driver is not inflation.
| Driver | Detail |
|---|---|
| Fiscal deficit | More long-end issuance |
| AI infrastructure funding | Corporate bonds pouring out to pay for capex |
| Term premium | Higher compensation demanded for duration |
The evidence is curve steepening. The 2-year is falling while only the 30-year rises. An inflation problem would lift the front end too. This is long-end supply, not prices.
Which creates this structure. AI capex raises memory demand. The bonds funding that capex push the 30-year up. The same boom works on my position in both directions at once.
The uncomfortable conclusion: the more the main body confirms, the more upward pressure on rates. On July 30 I wrote that demand was confirmed but rates buried it. Those two were never separate. They are one thing.
July CPI lands on August 12. The June print came in below expectations, but the 30-year is a separate axis, so a cool number does not guarantee it comes down.
Why a 1.55M to 1.90M range
The weekly-candle rule alone does not explain why 1.816M matters. Mapping who is trapped at which price does.
| Price band | Character | Who is there |
|---|---|---|
| 1.92-1.97M | Prior high, a break means trend change | |
| 1.80-1.92M | Thick resistance | Retail who bought the week before the crash, sellers at break-even |
| 1.816M | Entry to the supply zone, first resistance | This week's weekly high |
| 1.718M | Current | |
| 1.55-1.65M | Middle layer, thinning | 7/24 and 7/28 retail buys, absorbed into the limit-up |
| 1.32M | Hard support | Foreign buying at the bottom (+444K on 7/30, +2.206M on 7/31). They do not throw it |
The key is that 1.32M is support rather than resistance. Someone who bought the bottom is below current price and in profit, so they are not overhead supply. And the buyer there was foreign money. The supply above, by contrast, is retail trapped just before the crash.
Weak hands above, strong hands below. That is a textbook-good structure. If foreigners keep buying they eat through the weak-hand supply and break the upper band; if they cool off it stays in a range.
The probability map for next week
Not a forecast, a set of branch conditions. And memory and software get read together because of the seesaw.
| Scenario | Odds | Hynix | Trigger | |
|---|---|---|---|---|
| A | Digesting the spike | 45% | 1.55-1.75M range | Natural give-back, foreign buying slows |
| B | Memory extends | 30% | Attempts 1.816M | Foreign buying persists, rates stable |
| C | Broad risk-off | 25% | Retests 1.32M | 30-year spikes, or the foreign bid proves a dead cat |
The base case is A. Micron giving back 5% the day after its spike is the preview. Note that C breaks the seesaw: in a rates-driven risk-off, semis and software fall together.
So why did I not sell the leverage
I wrote "clear it into the spike" on July 31 and then did not do it. That was a deliberate hold, not an oversight, for two reasons.
First, the bad news had all cleared that day. Demand fear, the round-tripping worry and all three layers of forced selling were confirmed resolved. Selling on the day the clouds lift felt worse than taking one more look before deciding.
Second, 5 million won of leverage is an amount I can lose in full. The 10 million cap per name was set on exactly that premise. So this is not a rule violation, it is buying upside with money whose maximum loss was defined in advance. It is a different instrument from the common stock: the common carries the thesis, the leverage is closer to an option with a defined loss.
There is a trap in that, though. Time itself is the cost of a leveraged product. Without a deadline, a hold becomes neglect. So I fixed the condition as a number.
The leverage switch plan
- First target 1.816M
- Sell the leveraged sleeve in full as it enters the supply zone and meets resistance
- Immediately
- Buy Hynix common with the proceeds
- Second target 2.00M
- Sit through the 1.80-1.92M grind in the common
- Principle
- Keep the target, change the vehicle
The reasoning: getting to 2 million means breaking through the thickest supply band on the chart, 1.80 to 1.92M. Even with foreigners pushing, that zone means a fight with break-even sellers and a likely grind of days or weeks. The common can sit through a grind. The leveraged sleeve melts in one. Carrying 2x up to 1.9M means taking every volatility punch on the way.
The directional call stays. Only the vehicle changes.
What this log left me
There are parts I should state plainly. Failing to buy after the GO on July 23 was hesitation, not discipline. The 8% drop the next day made it look like a good outcome, but that was not my judgment being right. And on July 29 my structural stop at 1.45M was breached on a closing basis and I did not execute it. I judged the thesis to be intact, but the fact is I resolved a rule conflict with discretion. I am not going to conclude the July 31 limit-up proved me right.
What I am watching in August
| Item | How to check |
|---|---|
| Bottom confirmation | Does next week take out this week's high near 1.816M? Until then it is formation, not confirmation |
| Foreign flow persistence | Three or more consecutive sessions of net buying, or a one-day dead cat? |
| Rates | 30-year at 5.28%. Above 5.3% I treat it as a risk-off trigger |
| Credit | Hynix CDS at 75bp, and does Nvidia cross the hyperscaler band top of 94bp? |
| Supply clock | DRAM contract price growth slowing, actual CXMT ramp, HBM premium compression. Two or more deteriorating means cutting weight |
| Leverage rule effect | Size of forced liquidations on the next down day. One up day proves nothing |
| Rotation direction | Software running again means money leaving semis |
| Scheduled events | July CPI on 8/12, SaaS earnings late August, FOMC 9/15-16 |
One more thing. The realistic ceiling on this rebound is the overshoot portion. This decline had two layers. The structural re-rating (foreigners selling 150.7 trillion won since May, CXMT's arrival, the growth rate passing its peak) does not come back. The disproportionate 7.18 percentage points of July 28 and the forced-selling component does. A recovery into the 1.6M range is the reasonable expectation, not a return to the June 22 high of 2.919M.
Finally, the sentence that stayed next to my screen the whole time.
Let events set the direction of the investment, and let flows and price set the timing and the size.
Disclaimer
This is my personal trading log and study notes, not investment advice. Every amount, weight and stop level here was set against my own risk tolerance and does not transfer to anyone else. Leveraged ETFs in particular erode principal through daily rebalancing even in a flat market, which is why I classified mine for disposal. All scenario probabilities in this piece are my own subjective estimates, and several of them were wrong and revised within the log itself. Responsibility for investment decisions and outcomes rests with the investor.
Sources
SK Hynix Q2 results (7/29)
- SK Hynix Q2 revenue 79.3T won, operating profit 60.5T won · Financial News
- SK Hynix results miss market expectations · Hankook Ilbo
- High-value HBM shipments deferred to H2 · inews24
Hyperscaler results and capex (7/29-30)
- Microsoft Q4 2026 earnings call transcript, Azure +43% · Investing.com
- Microsoft Q4 2026 results · CNBC
- Meta Q2 2026 results, stock falls on capex raise · CNBC
- Meta Q2 2026 earnings call transcript · Investing.com
- Amazon Q2 2026, AWS +37% and capex to $220B · TradingKey
- Amazon Q2 2026 results · CNBC
Samsung final results (7/30)
- Samsung chip operating profit at a record 89T won · Money Today
- HBM crosses 50% of DRAM revenue for the first time · Financial News
Crash and rebound coverage
- Kimi K3 cheap-AI shock and SOX weakness · Korea Economic Daily
- Nvidia OpenAI investment talks and bubble warnings · Money Today
- 7/29 retail selling, institutional bargain hunting · Money Today
- Long-end yields surge after the FOMC · Newspim
- 30-year Treasury yield breaks 5.2% · Herald Business
- Foreign buying turns, semiconductors recover · Boan News
- Massive foreign net buying on 7/31 · Money Today
- Buy-side sidecar triggered on 7/31 · Newspim
The July 31 US session and the August setup
- Wall Street closes July ignoring the bond move · Washington Post
- Market live blog, July 31 · Yahoo Finance
- Apple slides on supply constraints and weak guidance · SiliconANGLE
- Nvidia releases new physical AI models · NVIDIA Newsroom
- Google DeepMind unveils Gemini Robotics 2 · Robotics and Automation News
- Software rebounds on AI rotation · 24/7 Wall St.
Rates and the FOMC
- Fed rate decision, July 2026 · CNBC
- The 30-year Treasury stayed above 5% for most of July · CFO Brew
Margin calls and margin lending
Hedge fund deleveraging
- Citadel buys the Situational Awareness portfolio · TechTimes
- Leopold Aschenbrenner and how his AI hedge fund unraveled · Invezz
CXMT and the supply cycle
- CXMT IPO and the threat assessment for Samsung and SK Hynix · Seoul Economic Daily
- Memory prices seen peaking in Q4 · Newspim
- DRAM cycle position and peak timing indicators · Luminix
- Oversupply concerns called premature · Betanews
Valuation comparison
Kimi K3 and memory demand
- Moonshot's Kimi K3 may be more about memory than compute · Bloomberg
- Kimi K3 memory demand analysis · BigGo
CDS raw data
Closes, flows, FX and deposit data were pulled directly from Naver Finance and cross-checked against confirmed post-close figures. Correlations, the disproportionate-drop calculation, ADR conversions and cost-basis simulations are my own.